Monthly Summary: August 2012
Finally
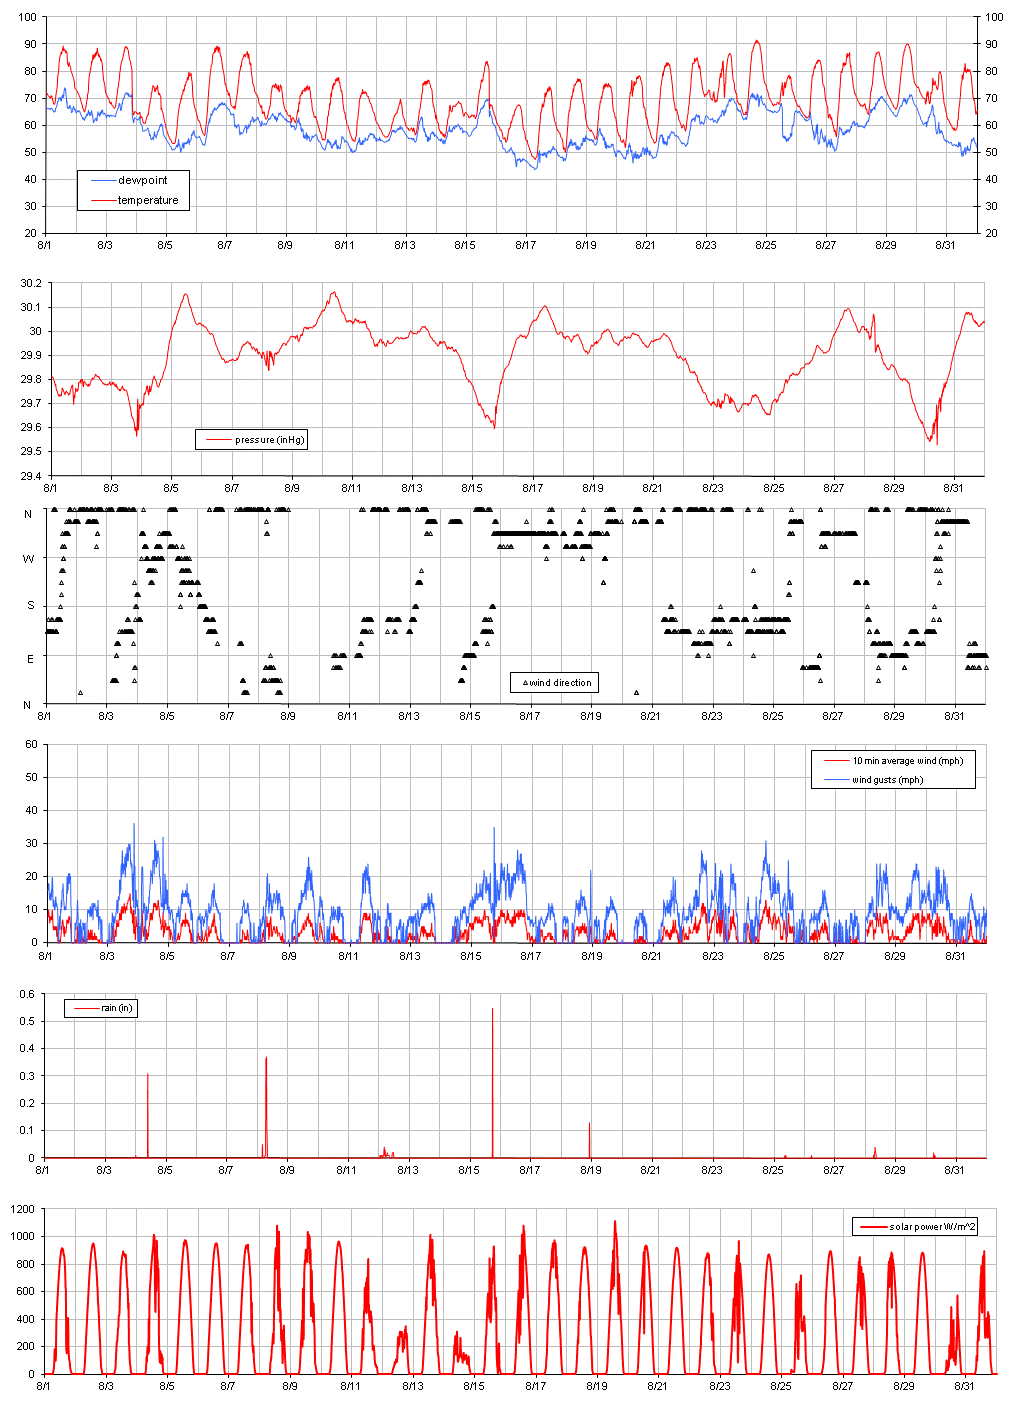
a near-average month with average rainfall. August 15, 2012, saw a hail
storm with hail stones of cherry to small plum size.
As for
the climate graph: all months since November 2011 have been above the 90-years
average temperature, and below the 90-year average rainfall (with the exception
of May). Another year with a very similar pattern was 1934.
All
data refer to the time since June 7, 2007, as measured by the UMM weather
station. Averages refer to data taken by the Morris Co-op and the USDA Soils
Lab.
|
Aug-12 |
10-year average |
50-year average |
90-year average |
||||||
|
Temperature |
Monthly Mean: |
69.7 |
oF |
69.1 |
oF |
68.4 |
oF |
69.0 |
oF |
|
20.9 |
oC |
20.6 |
oC |
20.2 |
oC |
20.6 |
oC |
||
|
Monthly max: |
91.7 |
oF |
91.0 |
oF |
92.4 |
oF |
93.7 |
oF |
|
|
33.2 |
oC |
32.8 |
oC |
33.5 |
oC |
34.3 |
oC |
||
|
Monthly min: |
47.2 |
oF |
46.9 |
oF |
44.6 |
oF |
44.1 |
oF |
|
|
8.4 |
oC |
8.3 |
oC |
7.0 |
oC |
6.7 |
oC |
||
|
Liquid
precipitation |
Total: |
2.88 |
in |
2.70 |
in |
3.15 |
in |
3.01 |
in |
|
73.2 |
mm |
68.5 |
mm |
80.0 |
mm |
76.4 |
mm |
||
|
Wind
gust |
max: |
36 |
mph |
||||||
|
16 |
m/s |
||||||||
|
Solar
Radiation: |
total month |
189.3 |
kWh/m2 |
||||||
|
average daily |
6.3 |
kWh/m2 |
|||||||
SB, 9/4/12