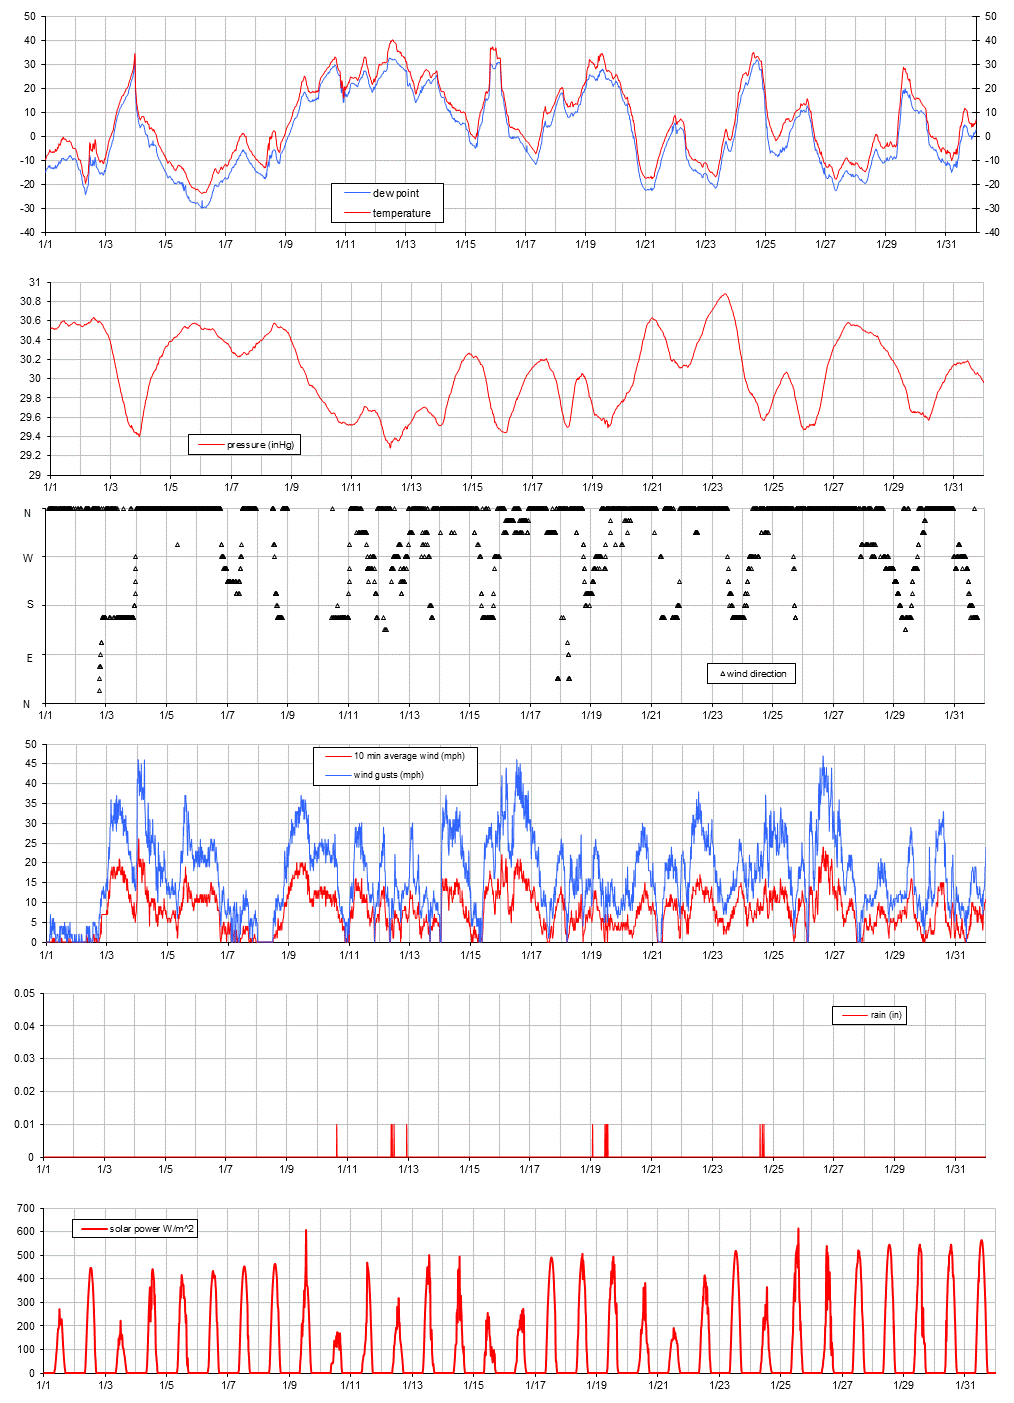
Monthly Summary: January 2014
This
is, by all accounts, an average January, if compared to the 95-year record.
Minimum and maximum temperature are almost exactly average. The mena was 3 degrees lower. One can attribute the impression
of having had a particularly grim winter to our own spoiledness.
All
data refer to the time since June 7, 2007, as measured by the UMM weather
station. Averages refer to data taken by the Morris Co-op and the USDA Soils
Lab.
|
Jan-14 |
10-year average |
50-year average |
90-year average |
||||||
|
Temperature |
Monthly Mean: |
6.0 |
oF |
11.6 |
oF |
8.7 |
oF |
9.1 |
oF |
|
-14.4 |
oC |
-11.3 |
oC |
-12.9 |
oC |
-12.7 |
oC |
||
|
Monthly max: |
40.1 |
oF |
41.0 |
oF |
40.0 |
oF |
40.5 |
oF |
|
|
4.5 |
oC |
5.0 |
oC |
4.4 |
oC |
4.7 |
oC |
||
|
Monthly min: |
-23.8 |
oF |
-19.4 |
oF |
-22.5 |
oF |
-23.5 |
oF |
|
|
-31.0 |
oC |
-28.5 |
oC |
-30.3 |
oC |
-30.9 |
oC |
||
|
Liquid
precipitation |
Total: |
0.13 |
in |
0.16 |
in |
0.67 |
in |
0.63 |
in |
|
3.3 |
mm |
4.2 |
mm |
16.9 |
mm |
16.1 |
mm |
||
|
Wind
gust |
max: |
47 |
mph |
||||||
|
21 |
m/s |
||||||||
|
Solar
Radiation: |
total month |
64.5 |
kWh/m2 |
||||||
|
average daily |
2.2 |
kWh/m2 |
|||||||
SB, 2/14/14