Monthly Summary: July 2012
The
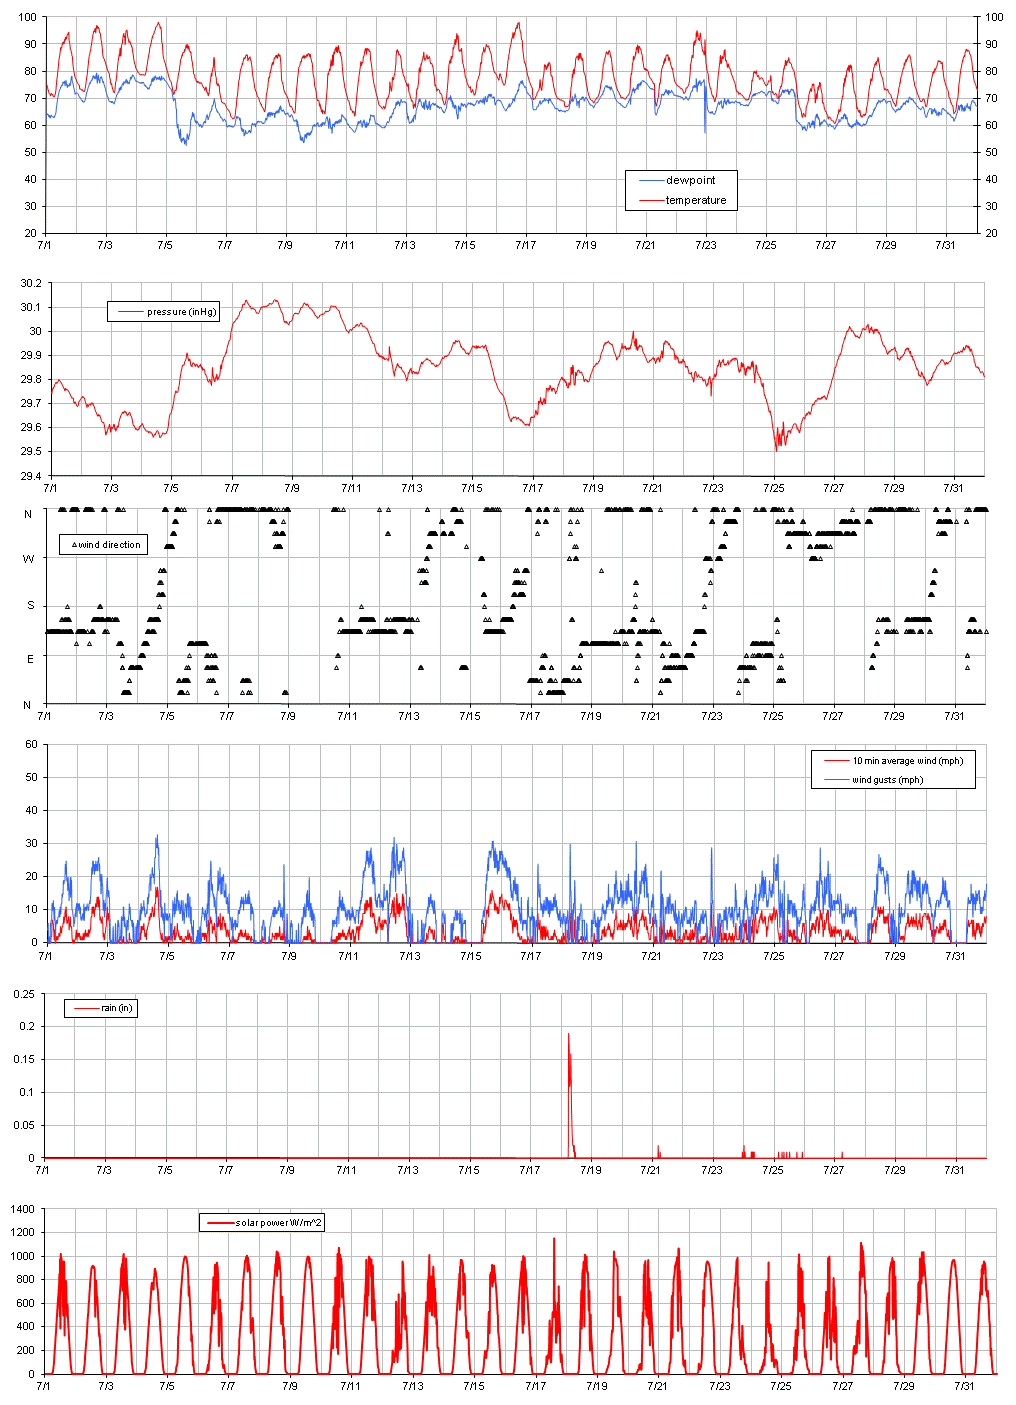
average temperature is about 5 degrees above normal.
However,
the minimum temperature lies 10 degrees above the long-term average. Combined
with the rain deficit, this was a difficult july for agriculture.
Compared to other parts of the great plains,
however, we are still in pretty good shape. Much of the country (all great plain states) have been
locked into a heat/drought pattern since June. Harvests will be low.
As for
the climate graph: all months since November 2011 have been above the 90-years
average temperature, and below the 90-year average rainfall (with the exception
of May). Another year with a very similar pattern was 1934.
All
data refer to the time since June 7, 2007, as measured by the UMM weather
station. Averages refer to data taken by the Morris Co-op and the USDA Soils
Lab.
|
Jul-12 |
10-year average |
50-year average |
90-year average |
||||||
|
Temperature |
Monthly Mean: |
77.7 |
oF |
73.1 |
oF |
71.2 |
oF |
71.3 |
oF |
|
25.4 |
oC |
22.9 |
oC |
21.8 |
oC |
21.8 |
oC |
||
|
Monthly max: |
98.3 |
oF |
95.0 |
oF |
93.8 |
oF |
95.0 |
oF |
|
|
36.8 |
oC |
35.0 |
oC |
34.3 |
oC |
35.0 |
oC |
||
|
Monthly min: |
60.4 |
oF |
53.2 |
oF |
48.7 |
oF |
48.0 |
oF |
|
|
15.8 |
oC |
11.8 |
oC |
9.3 |
oC |
8.9 |
oC |
||
|
Liquid
precipitation |
Total: |
1.82 |
in |
2.49 |
in |
3.56 |
in |
3.52 |
in |
|
46.2 |
mm |
63.3 |
mm |
90.3 |
mm |
89.4 |
mm |
||
|
Wind
gust |
max: |
33 |
mph |
||||||
|
15 |
m/s |
||||||||
|
Solar
Radiation: |
total month |
208.1 |
kWh/m2 |
||||||
|
average daily |
6.9 |
kWh/m2 |
|||||||
SB, 8/1/12