Monthly Summary: May
2017
Average in
every way.
|
May-17 |
10-year average |
50-year average |
90-year average |
||||||
|
Temperature |
Monthly Mean: |
57.2 |
oF |
57.7 |
oF |
56.8 |
oF |
56.5 |
oF |
|
14.0 |
oC |
14.3 |
oC |
13.8 |
oC |
13.6 |
oC |
||
|
Monthly max: |
89.0 |
oF |
90.6 |
oF |
88.7 |
oF |
88.4 |
oF |
|
|
31.7 |
oC |
32.5 |
oC |
31.5 |
oC |
31.3 |
oC |
||
|
Monthly min: |
32.1 |
oF |
31.6 |
oF |
31.2 |
oF |
29.7 |
oF |
|
|
0.1 |
oC |
-0.2 |
oC |
-0.5 |
oC |
-1.3 |
oC |
||
|
Liquid
precipitation |
Total: |
2.99 |
in |
3.06 |
in |
2.95 |
in |
2.92 |
in |
|
75.9 |
mm |
77.7 |
mm |
74.9 |
mm |
74.2 |
mm |
||
|
Wind
gust |
max: |
46 |
mph |
|
|||||
|
21 |
m/s |
||||||||
|
Solar
Radiation: |
total month |
165.0 |
kWh/m2 |
||||||
|
average daily |
5.5 |
kWh/m2 |
|||||||
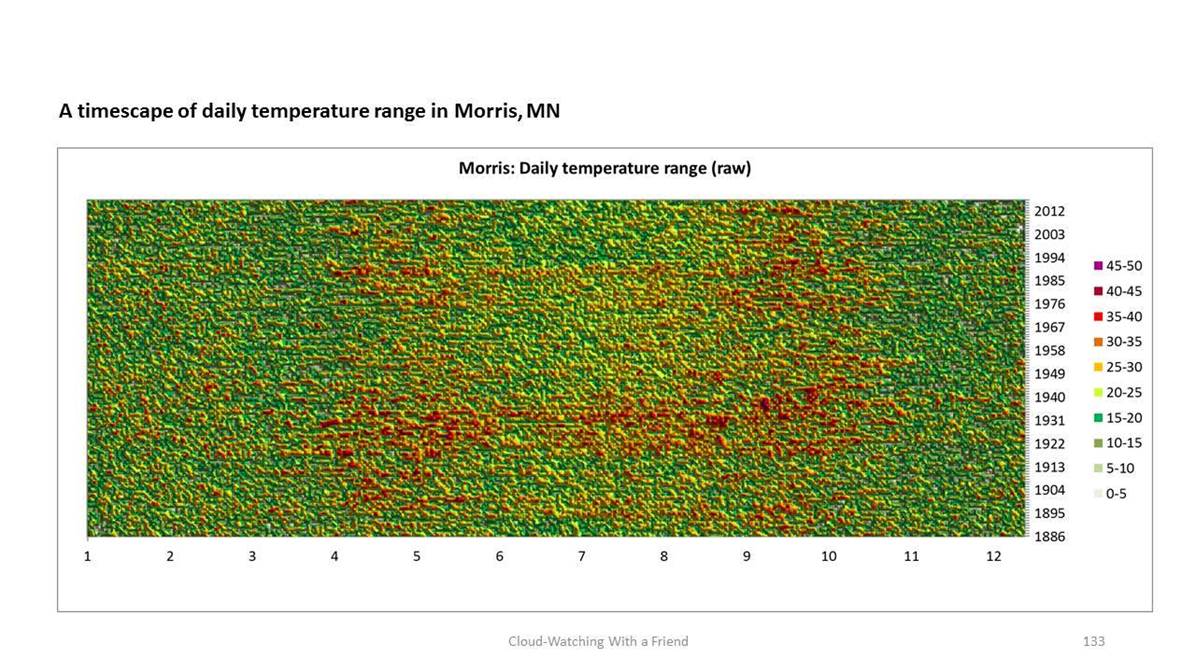
This
is not really a weather photo. However, I think this is the most instructive
graphics of the 133-year Morris temperature record I could come up with so far.
Horizontal axis is day of year (months are labeled). Vertical axis is the year.
The color codes the daily temperature range (DTR) for every single day over the
whole time period 1886 to 2016. The daily temperature range is the difference
between lowest and highest temperature in a single day. If not significant airmass movements occur on this day, this would be the
difference between sunrise temp and late afternoon temp.
SB, 7/25/17